
Page 45 - IJSA, Vol. 3, No 1, 2020
P. 45
рrint ISSN: 2617-2682; online ISSN: 2707-3637; DOI:10.26697/ijsa IJSA
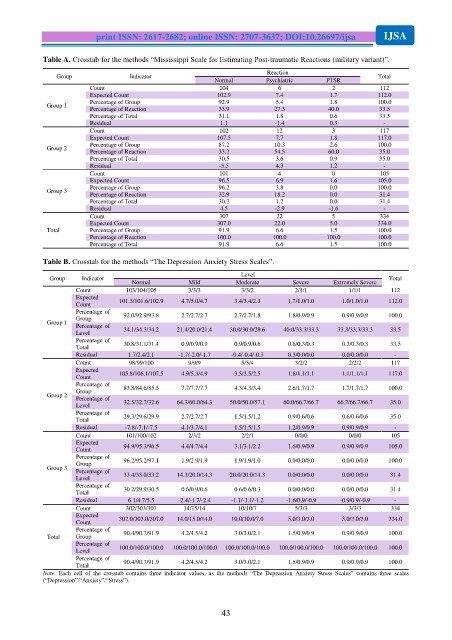
Table A. Crosstab for the methods “Mississippi Scale for Estimating Post-traumatic Reactions (military variant)”.
Reaction
Group Indicator Total
Normal Psychiatric PTSR
Count 104 6 2 112
Expected Count 102.9 7.4 1.7 112.0
Percentage of Group 92.9 5.4 1.8 100.0
Group 1
Percentage of Reaction 33.9 27.3 40.0 33.5
Percentage of Total 31.1 1.8 0.6 33.5
Residual 1.1 -1.4 0.3 -
Count 102 12 3 117
Expected Count 107.5 7.7 1.8 117.0
Percentage of Group 87.2 10.3 2.6 100.0
Group 2
Percentage of Reaction 33.2 54.5 60.0 35.0
Percentage of Total 30.5 3.6 0.9 35.0
Residual -5.5 4.3 1.2 -
Count 101 4 0 105
Expected Count 96.5 6.9 1.6 105.0
Percentage of Group 96.2 3.8 0.0 100.0
Group 3
Percentage of Reaction 32.9 18.2 0.0 31.4
Percentage of Total 30.2 1.2 0.0 31.4
Residual 4.5 -2.9 -1.6 -
Count 307 22 5 334
Expected Count 307.0 22.0 5.0 334.0
Total Percentage of Group 91.9 6.6 1.5 100.0
Percentage of Reaction 100.0 100.0 100.0 100.0
Percentage of Total 91.9 6.6 1.5 100.0
Table B. Crosstab for the methods “The Depression Anxiety Stress Scales”.
Level
Group Indicator Total
Normal Mild Moderate Severe Extremely Severe
Count 103/104/105 3/3/3 3/3/2 2/1/1 1/1/1 112
Expected 101.3/101.6/102.9 4.7/5.0/4.7 3.4/3.4/2.3 1.7/1.0/1.0 1.0/1.0/1.0 112.0
Count
Percentage of 92.0/92.9/93.8 2.7/2.7/2.7 2.7/2.7/1.8 1.8/0.9/0.9 0.9/0.9/0.9 100.0
Group
Group 1
Percentage of
Level 34.1/34.3/34.2 21.4/20.0/21.4 30.0/30.0/28.6 40.0/33.3/33.3 33.3/33.3/33.3 33.5
Percentage of
Total 30.8/31.1/31.4 0.9/0.9/0.9 0.9/0.9/0.6 0.6/0.3/0.3 0.3/0.3/0.3 33.5
Residual 1.7/2.4/2.1 -1.7/-2.0/-1.7 -0.4/-0.4/-0.3 0.3/0.0/0.0 0.0/0.0/0.0 -
Count 98/99/100 9/9/9 5/5/4 3/2/2 2/2/2 117
Expected
Count 105.8/106.1/107.5 4.9/5.3/4.9 3.5/3.5/2.5 1.8/1.1/1.1 1.1/1.1/1.1 117.0
Percentage of
Group 83.8/84.6/85.5 7.7/7.7/7.7 4.3/4.3/3.4 2.6/1.7/1.7 1.7/1.7/1.7 100.0
Group 2
Percentage of
Level 32.5/32.7/32.6 64.3/60.0/64.3 50.0/50.0/57.1 60.0/66.7/66.7 66.7/66.7/66.7 35.0
Percentage of 29.3/29.6/29.9 2.7/2.7/2.7 1.5/1.5/1.2 0.9/0.6/0.6 0.6/0.6/0.6 35.0
Total
Residual -7.8/-7.1/-7.5 4.1/3.7/4.1 1.5/1.5/1.5 1.2/0.9/0.9 0.9/0.9/0.9 -
Count 101/100/102 2/3/2 2/2/1 0/0/0 0/0/0 105
Expected 94.9/95.3/96.5 4.4/4.7/4.4 3.1/3.1/2.2 1.6/0.9/0.9 0.9/0.9/0.9 105.0
Count
Percentage of 96.2/95.2/97.1 1.9/2.9/1.9 1.9/1.9/1.0 0.0/0.0/0.0 0.0/0.0/0.0 100.0
Group
Group 3
Percentage of
Level 33.4/33.0/33.2 14.3/20.0/14.3 20.0/20.0/14.3 0.0/0.0/0.0 0.0/0.0/0.0 31.4
Percentage of
Total 30.2/29.9/30.5 0.6/0.9/0.6 0.6/0.6/0.3 0.0/0.0/0.0 0.0/0.0/0.0 31.4
Residual 6.1/4.7/5.5 -2.4/-1.7/-2.4 -1.1/-1.1/-1.2 -1.6/0.9/-0.9 -0.9/0.9/-0.9 -
Count 302/303/307 14/15/14 10/10/7 5/3/3 3/3/3 334
Expected
Count 302.0/303.0/307.0 14.0/15.0/14.0 10.0/10.0/7.0 5.0/3.0/3.0 3.0/3.0/3.0 334.0
Percentage of
Total Group 90.4/90.7/91.9 4.2/4.5/4.2 3.0/3.0/2.1 1.5/0.9/0.9 0.9/0.9/0.9 100.0
Percentage of
Level 100.0/100.0/100.0 100.0/100.0/100.0 100.0/100.0/100.0 100.0/100.0/100.0 100.0/100.0/100.0 100.0
Percentage of
Total 90.4/90.7/91.9 4.2/4.5/4.2 3.0/3.0/2.1 1.5/0.9/0.9 0.9/0.9/0.9 100.0
Note. Each cell of the crosstab contains three indicator values, as the methods “The Depression Anxiety Stress Scales” contains three scales
(“Depression”/“Anxiety”/“Stress”).
43