
Page 51 - IJSA, Vol. 3, No 1, 2020
P. 51
рrint ISSN: 2617-2682; online ISSN: 2707-3637; DOI:10.26697/ijsa IJSA
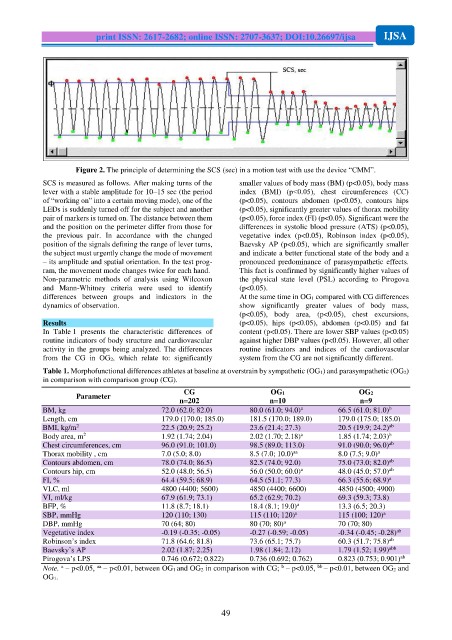
Figure 2. The principle of determining the SCS (sec) in a motion test with use the device “CMM”.
SCS is measured as follows. After making turns of the smaller values of body mass (BM) (p<0.05), body mass
lever with a stable amplitude for 10–15 sec (the period index (BMI) (p<0.05), chest circumferences (СC)
of “working on” into a certain moving mode), one of the (p<0.05), contours abdomen (p<0.05), contours hips
LEDs is suddenly turned off for the subject and another (p<0.05), significantly greater values of thorax mobility
pair of markers is turned on. The distance between them (p<0.05), force index (FI) (p<0.05). Significant were the
and the position on the perimeter differ from those for differences in systolic blood pressure (ATS) (p<0.05),
the previous pair. In accordance with the changed vegetative index (p<0.05), Robinson index (p<0.05),
position of the signals defining the range of lever turns, Baevsky AP (p<0.05), which are significantly smaller
the subject must urgently change the mode of movement and indicate a better functional state of the body and a
– its amplitude and spatial orientation. In the test prog- pronounced predominance of parasympathetic effects.
ram, the movement mode changes twice for each hand. This fact is confirmed by significantly higher values of
Non-parametric methods of analysis using Wilcoxon the physical state level (PSL) according to Pirogova
and Mann-Whitney criteria were used to identify (p<0.05).
differences between groups and indicators in the At the same time in OG1 compared with CG differences
dynamics of observation. show significantly greater values of body mass,
(p<0.05), body area, (p<0.05), chest excursions,
Results (p<0.05), hips (p<0.05), abdomen (p<0.05) and fat
In Table 1 presents the characteristic differences of content (p<0.05). There are lower SBP values (p<0.05)
routine indicators of body structure and cardiovascular against higher DBP values (p<0.05). However, all other
activity in the groups being analyzed. The differences routine indicators and indices of the cardiovascular
from the CG in OG2, which relate to: significantly system from the CG are not significantly different.
Table 1. Morphofunctional differences athletes at baseline at overstrain by sympathetic (OG 1) and parasympathetic (OG2)
in comparison with comparison group (CG).
CG
Parameter OG1 OG2
n=202 n=10 n=9
b
a
BM, kg 72.0 (62.0; 82.0) 80.0 (61.0; 94.0) 66.5 (61.0; 81.0)
Length, сm 179.0 (170.0; 185.0) 181.5 (170.0; 189.0) 179.0 (175.0; 185.0)
ab
2
BMI, kg/m 22.5 (20.9; 25.2) 23.6 (21.4; 27.3) 20.5 (19.9; 24.2)
2
a
b
Body area, m 1.92 (1.74; 2.04) 2.02 (1.70; 2.18) 1.85 (1.74; 2.03)
ab
Chest circumferences, cm 96.0 (91.0; 101.0) 98.5 (89.0; 113.0) 91.0 (90.0; 96.0)
aa
Thorax mobility , cm 7.0 (5.0; 8.0) 8.5 (7.0; 10.0) 8.0 (7.5; 9.0)
a
ab
Contours abdomen, cm 78.0 (74.0; 86.5) 82.5 (74.0; 92.0) 75.0 (73.0; 82.0)
a
ab
Contours hip, cm 52.0 (48.0; 56.5) 56.0 (50.0; 60.0) 48.0 (45.0; 57.0)
a
FІ, % 64.4 (59.5; 68.9) 64.5 (51.1; 77.3) 66.3 (55.6; 68.9)
VLC, ml 4800 (4400; 5600) 4850 (4400; 6600) 4850 (4500; 4900)
VI, ml/kg 67.9 (61.9; 73.1) 65.2 (62.9; 70.2) 69.3 (59.3; 73.8)
a
BFP, % 11.8 (8.7; 18.1) 18.4 (8.1; 19.0) 13.3 (6.5; 20.3)
a
a
SBP, mmHg 120 (110; 130) 115 (110; 120) 115 (100; 120)
a
DBP, mmHg 70 (64; 80) 80 (70; 80) 70 (70; 80)
ab
Vegetative index -0.19 (-0.35; -0.05) -0.27 (-0.59; -0.05) -0.34 (-0.45; -0.28)
Robinson’s index 71.8 (64.6; 81.8) 73.6 (65.1; 75.7) 60.3 (51.7; 75.8)
ab
Baevsky’s AP 2.02 (1.87; 2.25) 1.98 (1.84; 2.12) 1.79 (1.52; 1.99) abb
Pirogova’s LPS 0.746 (0.672; 0.822) 0.736 (0.692; 0.762) 0.823 (0.753; 0.901)
ab
a
aa
bb
b
Note. – p<0.05, – p<0.01, between OG1 and OG2 in comparison with CG; – p<0.05, – p<0.01, between OG2 and
OG1.
49