
Page 38 - IJSA, Vol. 4, No 1, 2021
P. 38
International Journal of Science Annals, Vol. 4, No. 1, 2021
рrint ISSN: 2617-2682; online ISSN: 2707-3637; DOI:10.26697/ijsa
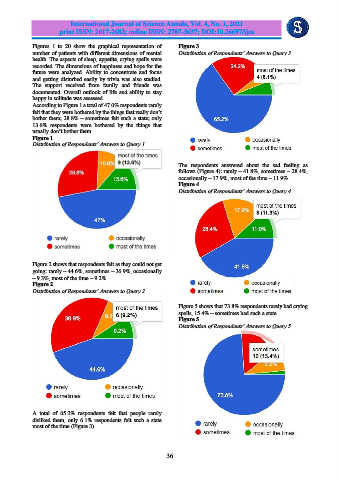
Figures 1 to 20 show the graphical representation of Figure 3
number of patients with different dimensions of mental Distribution of Respondents’ Answers to Query 3
health. The aspects of sleep, appetite, crying spells were
recorded. The dimensions of happiness and hope for the
future were analyzed. Ability to concentrate and focus
and getting disturbed easily by trivia was also studied.
The support received from family and friends was
documented. Overall outlook of life and ability to stay
happy in solitude was assessed.
According to Figure 1 a total of 47.0% respondents rarely
felt that they were bothered by the things that really don’t
bother them; 28.8% – sometimes felt such a state; only
13.6% respondents were bothered by the things that
usually don’t bother them.
Figure 1
Distribution of Respondents’ Answers to Query 1
The respondents answered about the sad feeling as
follows (Figure 4): rarely – 41.8%, sometimes – 28.4%,
occasionally – 17.9%, most of the time – 11.9%.
Figure 4
Distribution of Respondents’ Answers to Query 4
Figure 2 shows that respondents felt as they could not get
going: rarely – 44.6%, sometimes – 36.9%, occasionally
– 9.3%, most of the time – 9.2%.
Figure 2
Distribution of Respondents’ Answers to Query 2
Figure 5 shows that 73.8% respondents rarely had crying
spells, 15.4% – sometimes had such a state.
Figure 5
Distribution of Respondents’ Answers to Query 5
A total of 65.2% respondents felt that people rarely
disliked them, only 6.1% respondents felt such a state
most of the time (Figure 3).
36