
Page 16 - IJSA, Vol. 4, No 2, 2021
P. 16
International Journal of Science Annals, Vol. 5, No. 1-2, 2022
рrint ISSN: 2617-2682; online ISSN: 2707-3637; DOI:10.26697/ijsa
Table 4
Association between Educational Status and Level of Knowledge and Perception among Study Subjects
Knowledge, people (%) Perception, people (%)
Educational status
Good Average Poor Good Average Poor
Illiterate 52 (47.3) 30 (26.5) 17 (15.0) 70 (63.6) 16 (14.2) 13 (15.0)
Up to High school 66 (58.4) 37 (33.6) 21 (19.1) 80 (70.8) 23 (20.9) 21 (15.5)
Graduate 24 (88.9) 3 (11.1) - 24 (88.9) 3 (11.1) -
P< 0.05* P< 0.05*
Note. *p<0.05 significant by applying Chi Square test
Table 5
Practices of Swachh Bharat Abhiyan among the Study Subjects
Frequency
Component Compliance
people %
Yes 182 72.8
Subjects having toilet facilities in house
No 68 27.2
Yes 62 24.8
Subjects preferring open defecation free
No 188 75.2
Yes 72 28.8
Using community sanitary latrines for defecation
No 178 71.2
Yes 145 58.0
Proper handwashing after going to latrines
No 155 42.0
Yes 19 7.6
Using both soap and water after defecation
No 231 92.4
Yes 3 1.2
Practicing proper steps of handwashing
No 247 98.8
Yes 142 56.8
Using community bin for solid waste disposal
No 108 44.2
Yes 168 67.2
Throwing of garbage waste in nearby places
No 82 33.8
Yes 81 32.4
Participated in SBA activities
No 169 67.6
Yes 238 95.2
Motivate people to participate in SBA activities
No 12 4.8
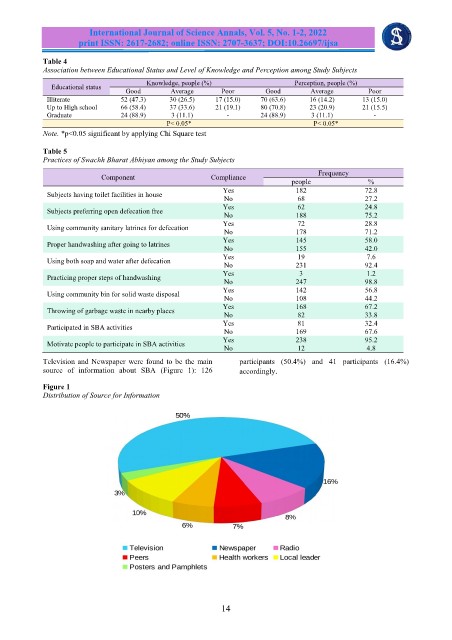
Television and Newspaper were found to be the main participants (50.4%) and 41 participants (16.4%)
source of information about SBA (Figure 1): 126 accordingly.
Figure 1
Distribution of Source for Information
14