Page 35 - IJSA, Vol. 4, No 2, 2021
P. 35

International Journal of Science Annals, Vol. 5, No. 1-2, 2022
                      рrint ISSN: 2617-2682; online ISSN: 2707-3637; DOI:10.26697/ijsa
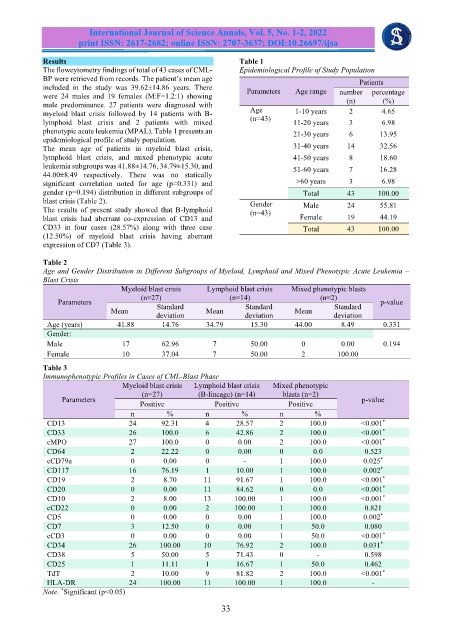
            Results                                             Table 1
            The flowcytometry findings of total of 43 cases of CML-  Epidemiological Profile of Study Population
            BP were retrieved from records. The patient’s mean age                              Patients
            included  in  the  study  was  39.62±14.86  years.  There   Parameters   Age range   number  percentage
            were  24  males  and  19  females  (M:F=1.2:1)  showing
            male  predominance.  27  patients  were  diagnosed  with                        (n)       (%)
            myeloid  blast  crisis  followed  by  14  patients  with  B-  Age   1-10 years   2        4.65
            lymphoid  blast  crisis  and  2  patients  with  mixed   (n=43)   11-20 years    3        6.98
            phenotypic acute leukemia (MPAL). Table 1 presents an             21-30 years    6       13.95
            epidemiological profile of study population.
            The  mean  age  of  patients  in  myeloid  blast  crisis,         31-40 years   14       32.56
            lymphoid  blast  crisis,  and  mixed  phenotypic  acute           41-50 years    8       18.60
            leukemia subgroups was 41.88±14.76, 34.79±15.30, and              51-60 years    7       16.28
            44.00±8.49  respectively.  There  was  no  statically
            significant  correlation  noted  for  age  (p=0.331)  and          >60 years     3        6.98
            gender (p=0.194) distribution in different subgroups of              Total      43       100.00
            blast crisis (Table 2).                                Gender
            The  results  of  present  study  showed  that  B-lymphoid   (n=43)   Male      24       55.81
            blast  crisis  had  aberrant  co-expression  of  CD13  and          Female      19       44.19
            CD33  in  four  cases  (28.57%)  along  with  three  case            Total      43       100.00
            (12.50%)  of  myeloid  blast  crisis  having  aberrant
            expression of CD7 (Table 3).

            Table 2
            Age and Gender Distribution in Different Subgroups of Myeloid, Lymphoid and Mixed Phenotypic Acute Leukemia –
            Blast Crisis
                                 Myeloid blast crisis   Lymphoid blast crisis   Mixed phenotypic blasts
                                      (n=27)                 (n=14)                  (n=2)
                Parameters                                                                           p-value
                              Mean        Standard     Mean       Standard     Mean      Standard
                                          deviation               deviation              deviation
             Age (years)        41.88       14.76      34.79       15.30       44.00       8.49       0.331
             Gender:
             Male                17         62.96        7         50.00        0          0.00       0.194
             Female              10         37.04        7         50.00        2         100.00

            Table 3
            Immunophenotypic Profiles in Cases of CML-Blast Phase
                                 Myeloid blast crisis   Lymphoid blast crisis   Mixed phenotypic
                                      (n=27)         (B-lineage) (n=14)    blasts (n=2)
                 Parameters                                                                     p-value
                                      Positive            Positive           Positive
                                   n         %         n         %         n        %
             CD13                  24       92.31      4       28.57       2       100.0        <0.001
                                                                                                      *
             CD33                  26       100.0      6       42.86       2       100.0        <0.001
                                                                                                      *
                                                                                                      *
             cMPO                  27       100.0      0        0.00       2       100.0        <0.001
             CD64                  2        22.22      0        0.00       0        0.0          0.523
                                                                                                     *
             cCD79a                0        0.00       0         -         1       100.0         0.025
             CD117                 16       76.19      1       10.00       1       100.0         0.002
                                                                                                     *
             CD19                  2        8.70       11      91.67       1       100.0        <0.001
                                                                                                      *
             CD20                  0        0.00       11      84.62       0        0.0         <0.001
                                                                                                      *
             CD10                  2        8.00       13      100.00      1       100.0        <0.001
                                                                                                      *
             cCD22                 0        0.00       2       100.00      1       100.0         0.821
                                                                                                     *
             CD5                   0        0.00       0        0.00       1       100.0         0.002
             CD7                   3        12.50      0        0.00       1       50.0          0.080
             cCD3                  0        0.00       0        0.00       1       50.0         <0.001
                                                                                                      *
                                                                                                     *
             CD34                  26      100.00      10      76.92       2       100.0         0.031
             CD38                  5        50.00      5       71.43       0        -            0.598
             CD25                  1        11.11      1       16.67       1       50.0          0.462
                                                                                                      *
             TdT                   2        10.00      9       81.82       2       100.0        <0.001
             HLA-DR                24      100.00      11      100.00      1       100.0           -
                 *
            Note.  Significant (p<0.05)
                                                           33
   30   31   32   33   34   35   36   37   38   39   40