
Page 44 - IJSA, Vol. 6, No 2, 2023
P. 44
International Journal of Science Annals, Vol. 6, No. 2, 2023
рrint ISSN: 2617-2682; online ISSN: 2707-3637; DOI:10.26697/ijsa
Table 1 According to Cohen et al. (2018), a significance level of
Overall Reliability Statistics of the Measuring 0.05 is regarded as acceptable. By providing a
Instrument relationship between the variables that could be used to
Reliability statistics predict the values of the independent variables. The
Cronbach’s alpha findings demonstrated in Table 1 show that all the
Cronbach’s based on Number of hypothesized relationships were accepted, with the
alpha standardized items exception of environmental aspects in order to develop
items the final research model. The population of the study
0.960 0.960 32 based on the district hospital level was 150 respondents.
Age, level of education, work experience, job position
Results and cloud awareness were the different demographic
The set of hypotheses were evaluated using regression and situational variables that were identified as being
analysis, with the findings being reported. The statistical relevant for this study. Participant’s demographics are
analysis of the data were performed using SPSS 25.0. shown in Table 2, which is broken down into the
relevant categories..
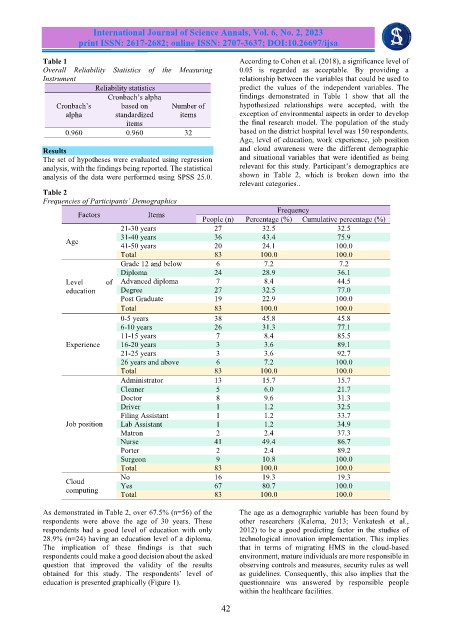
Table 2
Frequencies of Participants’ Demographics
Frequency
Factors Items
People (n) Percentage (%) Cumulative percentage (%)
21-30 years 27 32.5 32.5
31-40 years 36 43.4 75.9
Age
41-50 years 20 24.1 100.0
Total 83 100.0 100.0
Grade 12 and below 6 7.2 7.2
Diploma 24 28.9 36.1
Level of Advanced diploma 7 8.4 44.5
education Degree 27 32.5 77.0
Post Graduate 19 22.9 100.0
Total 83 100.0 100.0
0-5 years 38 45.8 45.8
6-10 years 26 31.3 77.1
11-15 years 7 8.4 85.5
Experience 16-20 years 3 3.6 89.1
21-25 years 3 3.6 92.7
26 years and above 6 7.2 100.0
Total 83 100.0 100.0
Administrator 13 15.7 15.7
Cleaner 5 6.0 21.7
Doctor 8 9.6 31.3
Driver 1 1.2 32.5
Filing Assistant 1 1.2 33.7
Job position Lab Assistant 1 1.2 34.9
Matron 2 2.4 37.3
Nurse 41 49.4 86.7
Porter 2 2.4 89.2
Surgeon 9 10.8 100.0
Total 83 100.0 100.0
No 16 19.3 19.3
Cloud Yes 67 80.7 100.0
computing
Total 83 100.0 100.0
As demonstrated in Table 2, over 67.5% (n=56) of the The age as a demographic variable has been found by
respondents were above the age of 30 years. These other researchers (Kalema, 2013; Venkatesh et al.,
respondents had a good level of education with only 2012) to be a good predicting factor in the studies of
28.9% (n=24) having an education level of a diploma. technological innovation implementation. This implies
The implication of these findings is that such that in terms of migrating HMS in the cloud-based
respondents could make a good decision about the asked environment, mature individuals are more responsible in
question that improved the validity of the results observing controls and measures, security rules as well
obtained for this study. The respondents’ level of as guidelines. Consequently, this also implies that the
education is presented graphically (Figure 1). questionnaire was answered by responsible people
within the healthcare facilities.
42