
Page 45 - IJSA, Vol. 6, No 2, 2023
P. 45
International Journal of Science Annals, Vol. 6, No. 2, 2023
рrint ISSN: 2617-2682; online ISSN: 2707-3637; DOI:10.26697/ijsa
Figure 1
Respondents’ Level of Education
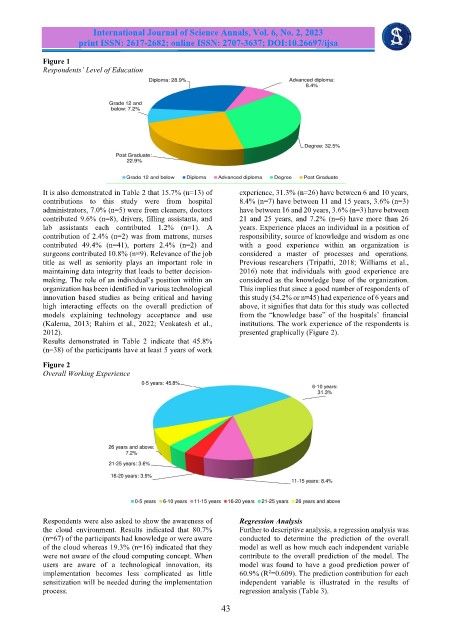
It is also demonstrated in Table 2 that 15.7% (n=13) of experience, 31.3% (n=26) have between 6 and 10 years,
contributions to this study were from hospital 8.4% (n=7) have between 11 and 15 years, 3.6% (n=3)
administrators, 7.0% (n=5) were from cleaners, doctors have between 16 and 20 years, 3.6% (n=3) have between
contributed 9.6% (n=8), drivers, filling assistants, and 21 and 25 years, and 7.2% (n=6) have more than 26
lab assistants each contributed 1.2% (n=1). A years. Experience places an individual in a position of
contribution of 2.4% (n=2) was from matrons, nurses responsibility, source of knowledge and wisdom as one
contributed 49.4% (n=41), porters 2.4% (n=2) and with a good experience within an organization is
surgeons contributed 10.8% (n=9). Relevance of the job considered a master of processes and operations.
title as well as seniority plays an important role in Previous researchers (Tripathi, 2018; Williams et al.,
maintaining data integrity that leads to better decision- 2016) note that individuals with good experience are
making. The role of an individual’s position within an considered as the knowledge base of the organization.
organization has been identified in various technological This implies that since a good number of respondents of
innovation based studies as being critical and having this study (54.2% or n=45) had experience of 6 years and
high interacting effects on the overall prediction of above, it signifies that data for this study was collected
models explaining technology acceptance and use from the “knowledge base” of the hospitals’ financial
(Kalema, 2013; Rahim et al., 2022; Venkatesh et al., institutions. The work experience of the respondents is
2012). presented graphically (Figure 2).
Results demonstrated in Table 2 indicate that 45.8%
(n=38) of the participants have at least 5 years of work
Figure 2
Overall Working Experience
Respondents were also asked to show the awareness of Regression Analysis
the cloud environment. Results indicated that 80.7% Further to descriptive analysis, a regression analysis was
(n=67) of the participants had knowledge or were aware conducted to determine the prediction of the overall
of the cloud whereas 19.3% (n=16) indicated that they model as well as how much each independent variable
were not aware of the cloud computing concept. When contribute to the overall prediction of the model. The
users are aware of a technological innovation, its model was found to have a good prediction power of
2
implementation becomes less complicated as little 60.9% (R =0.609). The prediction contribution for each
sensitization will be needed during the implementation independent variable is illustrated in the results of
process. regression analysis (Table 3).
43