
Page 27 - IJSA, Vol. 3, No 2, 2020
P. 27
рrint ISSN: 2617-2682; online ISSN: 2707-3637; DOI:10.26697/ijsa IJSA
Introduction
The world which we lived in, has changed for several Certainly, strict authoritarian government measures
months of 2020, and will never be the same as before. have produced a significant effect on resisting the spread
Nowadays the whole human race is undergoing a crisis of the COVID-19 pandemic in China. Still, the issues of
whose duration and consequences are difficult to how it is justified, what its efficiency is for an individual
forecast. Even model developers and computer country and the world on the whole, are left to be
specialists cannot give precise prognoses of the way analysed. Government policies in different states
further events related to the COVID-19 pandemic will concerning administrative measures (starting with
develop. closing borders and finishing with work of national
Science and technologies have turned to be powerless health systems) are necessary to be considered as well.
not only in terms of resisting this pandemic but also in The aim of the study. To explore the influence of
terms of foretelling how the events will change. The different approaches to solving the pandemic problem in
problem was that model developers did not have any Ukraine, Singapore, and China (from formal
idea of how the virus would behave in natural government measures to personal responsibility and
conditions. Modelling was based on the possibility to health culture of the population) on the indicators of
control the virus, i. e. control of the man as a virus’ COVID-19 dynamics.
master but not of a virus as a virus molecule beyond the
master. Materials and Methods
Despite an extremely tiny size (there can be tens of A complex of methods was used: theoretical – factor-
millions of virus entities on one square millimetre criterion analysis, abstraction, comparison, synthesis,
(Koops, 2020) and a short life of SARS-CoV-2 systematisation, generalisation; empirical –
Coronavirus, this period turned to be enough for its rapid observational methods (systematic observation);
spread around the whole world. methods of mathematical analysis.
Undoubtedly this spread has been mainly caused by a
man’s significant role in it. But why have all the Results
measures over people who carry this virus, proved to be In the study of the quantity of those who have caught the
low-efficient in confronting this threat? The infection disease, and recovered after it, and the indices of the
that appeared on the territory of a sub-provincial town death rate to demonstrate different strategies by
Wuhan in the province of Hubei in China, has grown struggling the COVID-19 pandemic, we based on the
from a local problem into the one of an international official data of Johns Hopkins University, Coronavirus
scope just for several months. Resource Center (2020).
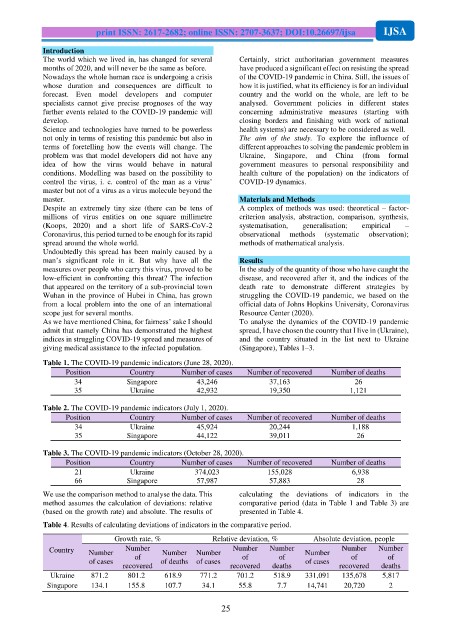
As we have mentioned China, for fairness’ sake I should To analyse the dynamics of the COVID-19 pandemic
admit that namely China has demonstrated the highest spread, I have chosen the country that I live in (Ukraine),
indices in struggling COVID-19 spread and measures of and the country situated in the list next to Ukraine
giving medical assistance to the infected population. (Singapore), Tables 1–3.
Table 1. The COVID-19 pandemic indicators (June 28, 2020).
Position Country Number of cases Number of recovered Number of deaths
34 Singapore 43,246 37,163 26
35 Ukraine 42,932 19,350 1,121
Table 2. The COVID-19 pandemic indicators (July 1, 2020).
Position Country Number of cases Number of recovered Number of deaths
34 Ukraine 45,924 20,244 1,188
35 Singapore 44,122 39,011 26
Table 3. The COVID-19 pandemic indicators (October 28, 2020).
Position Country Number of cases Number of recovered Number of deaths
21 Ukraine 374,023 155,028 6,938
66 Singapore 57,987 57,883 28
We use the comparison method to analyse the data. This calculating the deviations of indicators in the
method assumes the calculation of deviations: relative comparative period (data in Table 1 and Table 3) are
(based on the growth rate) and absolute. The results of presented in Table 4.
Table 4. Results of calculating deviations of indicators in the comparative period.
Growth rate, % Relative deviation, % Absolute deviation, people
Country Number Number Number Number Number Number Number Number Number
of cases of of deaths of cases of of of cases of of
recovered recovered deaths recovered deaths
Ukraine 871.2 801.2 618.9 771.2 701.2 518.9 331,091 135,678 5,817
Singapore 134.1 155.8 107.7 34.1 55.8 7.7 14,741 20,720 2
25