
Page 28 - IJSA, Vol. 3, No 2, 2020
P. 28
International Journal of Science Annals, Vol. 3, No. 2, 2020
The analysis of the deviations obtained shows that the
growth rate of the number of cases over four months was
871.2% in Ukraine and 134.1% in Singapore. The
increase in the number of cases by country in absolute
and relative terms, accordingly, amounted to 331,091
people or 771.2% (Ukraine) and 14,741 people or 34.1%
(Singapore).
The growth rate of the number of recovered people
during this period was 801.2% in Ukraine and 155.8%
in Singapore. The increase in the number of recovered
people by country in absolute and relative terms, Figure 2. Dynamics of the COVID-19 pandemic in
accordingly, amounted to 135,678 people or 701.2% Ukraine (for October 28, 2020). Courtesy: John Hopkins
(Ukraine) 20,720 people or 55.8% (Singapore). CSSE (https://gisanddata.maps.arcgis.com).
The growth rate of the number of deaths during this
period was 618.9% in Ukraine and 107.7% in Singapore.
The increase in the number of deaths in absolute and
relative terms across countries, accordingly, amounted
to 5,817 people or 518.9% (Ukraine) and 2 people or
7.7%.
Such a tendency indicates that over four months the
number of cases in Ukraine is 22.5 times higher than the
number of cases in Singapore. At the same time, the
number of recovered in Ukraine exceeds Singapore only
6.5 times. And the number of deaths in Ukraine is
multiple times higher than that in Singapore: 2908.5 Figure 3. Dynamics of the COVID-19 pandemic in
times. Singapore (for October 28, 2020). Courtesy: John
To analyse the overall dynamics of the COVID-19 Hopkins CSSE (https://gisanddata.maps.arcgis.com).
pandemic in the world in 2020, as well as the
comparative characteristics of the spread of infection in
individual countries, we add the indicators of the
country in which COVID-19 cases were first recorded –
China.
Figure 1 shows the general dynamics of the COVID-19
pandemic in the world, Figure 2 – in Ukraine, Figure 3
– in Singapore, Figure 4 – in China, in 2020.
Figure 4. Dynamics of the COVID-19 pandemic in
China (for October 28, 2020). Courtesy: John Hopkins
CSSE (https://gisanddata.maps.arcgis.com).
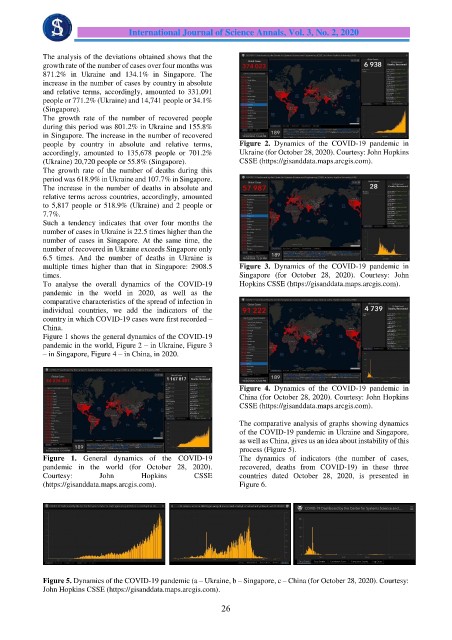
The comparative analysis of graphs showing dynamics
of the COVID-19 pandemic in Ukraine and Singapore,
as well as China, gives us an idea about instability of this
process (Figure 5).
Figure 1. General dynamics of the COVID-19 The dynamics of indicators (the number of cases,
pandemic in the world (for October 28, 2020). recovered, deaths from COVID-19) in these three
Courtesy: John Hopkins CSSE countries dated October 28, 2020, is presented in
(https://gisanddata.maps.arcgis.com). Figure 6.
Figure 5. Dynamics of the COVID-19 pandemic (a – Ukraine, b – Singapore, c – China (for October 28, 2020). Courtesy:
John Hopkins CSSE (https://gisanddata.maps.arcgis.com).
26