
Page 26 - IJSA, Vol. 4, No 2, 2021
P. 26
International Journal of Science Annals, Vol. 5, No. 1-2, 2022
рrint ISSN: 2617-2682; online ISSN: 2707-3637; DOI:10.26697/ijsa
were 2-3 times higher than similar indicators of groups 76.47% of women in groups 2 and 1. At the same time,
1 and 2. similar indicators for men in groups 3, 2, 1 were 84.62%,
It should be noted that, according to the results of the 93.75%, 94.90%, respectively.
study, anxiety is more pronounced in women of all Manifestations of depression among the KNUIA cadets
groups. The absence of anxiety symptoms was observed and students in the war and martial law conditions are
only in 66.67% of women in group 3, 76.74% and shown in Figure 3.
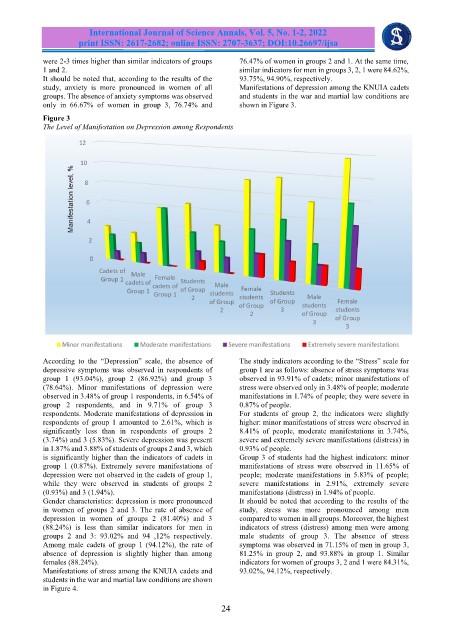
Figure 3
The Level of Manifestation on Depression among Respondents
According to the “Depression” scale, the absence of The study indicators according to the “Stress” scale for
depressive symptoms was observed in respondents of group 1 are as follows: absence of stress symptoms was
group 1 (93.04%), group 2 (86.92%) and group 3 observed in 93.91% of cadets; minor manifestations of
(78.64%). Minor manifestations of depression were stress were observed only in 3.48% of people; moderate
observed in 3.48% of group 1 respondents, in 6.54% of manifestations in 1.74% of people; they were severe in
group 2 respondents, and in 9.71% of group 3 0.87% of people.
respondents. Moderate manifestations of depression in For students of group 2, the indicators were slightly
respondents of group 1 amounted to 2.61%, which is higher: minor manifestations of stress were observed in
significantly less than in respondents of groups 2 8.41% of people, moderate manifestations in 3.74%,
(3.74%) and 3 (5.83%). Severe depression was present severe and extremely severe manifestations (distress) in
in 1.87% and 3.88% of students of groups 2 and 3, which 0.93% of people.
is significantly higher than the indicators of cadets in Group 3 of students had the highest indicators: minor
group 1 (0.87%). Extremely severe manifestations of manifestations of stress were observed in 11.65% of
depression were not observed in the cadets of group 1, people; moderate manifestations in 5.83% of people;
while they were observed in students of groups 2 severe manifestations in 2.91%, extremely severe
(0.93%) and 3 (1.94%). manifestations (distress) in 1.94% of people.
Gender characteristics: depression is more pronounced It should be noted that according to the results of the
in women of groups 2 and 3. The rate of absence of study, stress was more pronounced among men
depression in women of groups 2 (81.40%) and 3 compared to women in all groups. Moreover, the highest
(88.24%) is less than similar indicators for men in indicators of stress (distress) among men were among
groups 2 and 3: 93.02% and 94 ,12% respectively. male students of group 3. The absence of stress
Among male cadets of group 1 (94.12%), the rate of symptoms was observed in 71.15% of men in group 3,
absence of depression is slightly higher than among 81.25% in group 2, and 93.88% in group 1. Similar
females (88.24%). indicators for women of groups 3, 2 and 1 were 84.31%,
Manifestations of stress among the KNUIA cadets and 93.02%, 94.12%, respectively.
students in the war and martial law conditions are shown
in Figure 4.
24