
Page 15 - IJSA, Vol. 6, No 2, 2023
P. 15
International Journal of Science Annals, Vol. 6, No. 2, 2023
рrint ISSN: 2617-2682; online ISSN: 2707-3637; DOI:10.26697/ijsa
Results 2.766 for 100 degrees of freedom. The measure of the
Prediction of Arithmetic Skills quality of this adjustment given by the Akaike
The following table (Table 1) shows the coefficients of Information Criterion (AIC) is 501.05.
the explanatory variables of the athletes’ arithmetic Then, the covariates that should be included in the
skills. gamma model were automatically selected and a new
At the usual significance levels (5%), this model reveals adjustment value of the resulting model was performed.
that there is a significant covariate, namely anxiety According to the new adjusted model (Table 2), the new
symptoms. Residual deviations range from -0.43 to 0.40 coefficients and covariates of the model are identified.
and the calculated value of the residual deviation is
Table 1
Variable Coefficients: Age, Anxiety Symptoms, Lie, Attention: Processed Characters, Attention: Hits, Attention: Default
Errors, Attention: Errors by Marking Irrelevant Characters
Coefficients Estimated value SE t-value p-value
-
Intercept 2.139 0.122 17.423 ˂2e 16***
Age 0.007 0.009 0.77 0.44
Anxiety symptoms -0.007 0.004 -2.06 0.04*
Lie 0.002 0.007 0.36 0.72
Attention, PC 0.001 0.002 0.45 0.66
Attention, Hits 0.002 0.006 0.25 0.80
Attention, DE -0.003 0.006 -0.56 0.58
Attention, EMIC -0.009 0.005 -1.91 0.06
Note. SE – standard error; p-value: *0.05; **0.01; ***0.001; PC – processed characters; DE – default errors; EMIC –
errors by marking irrelevant characters.
Table 2
Variable Coefficients: Anxiety Symptoms, Attention: Processed Characters, Attention: Default Errors, Attention: Errors
by Marking Irrelevant Characters
Coefficients Estimated value SE t-value p-value
-
Intercept 2.222 0.082 27.161 ˂2e 16***
Anxiety symptoms -0.009 0.004 -2.48 0.015*
Attention, PC 0.002 0.000 8.86 2.51e 14***
-
Attention, DE -0.005 0.001 -4.00 0.000***
Attention, EMIC -0.009 0.005 -1.92 0.057
Note. SE – standard error; p-value: *0.05; **0.01; ***0.001; PC – processed characters; DE – default errors; EMIC –
errors by marking irrelevant characters.
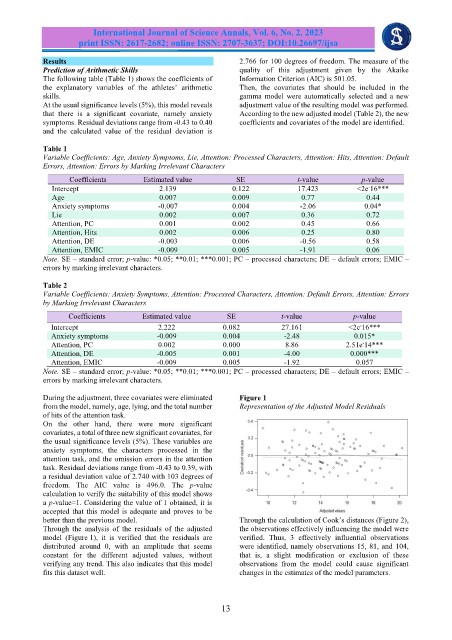
During the adjustment, three covariates were eliminated Figure 1
from the model, namely, age, lying, and the total number Representation of the Adjusted Model Residuals
of hits of the attention task.
On the other hand, there were more significant
covariates, a total of three new significant covariates, for
the usual significance levels (5%). These variables are
anxiety symptoms, the characters processed in the
attention task, and the omission errors in the attention
task. Residual deviations range from -0.43 to 0.39, with
a residual deviation value of 2.740 with 103 degrees of
freedom. The AIC value is 496.0. The p-value
calculation to verify the suitability of this model shows
a p-value=1. Considering the value of 1 obtained, it is
accepted that this model is adequate and proves to be
better than the previous model. Through the calculation of Cook’s distances (Figure 2),
Through the analysis of the residuals of the adjusted the observations effectively influencing the model were
model (Figure 1), it is verified that the residuals are verified. Thus, 3 effectively influential observations
distributed around 0, with an amplitude that seems were identified, namely observations 15, 81, and 104,
constant for the different adjusted values, without that is, a slight modification or exclusion of these
verifying any trend. This also indicates that this model observations from the model could cause significant
fits this dataset well. changes in the estimates of the model parameters.
13