
Page 16 - IJSA, Vol. 6, No 2, 2023
P. 16
International Journal of Science Annals, Vol. 6, No. 2, 2023
рrint ISSN: 2617-2682; online ISSN: 2707-3637; DOI:10.26697/ijsa
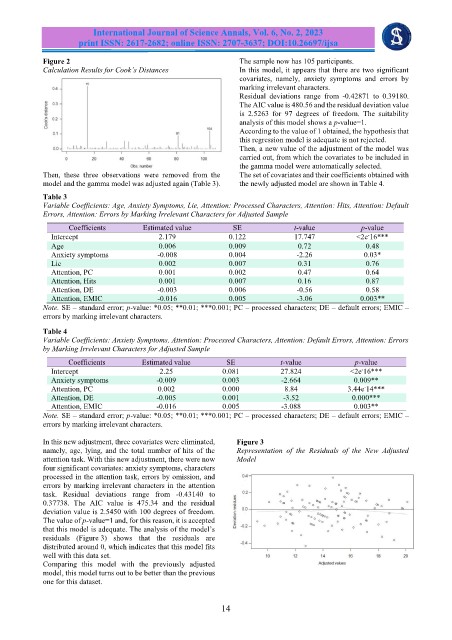
Figure 2 The sample now has 105 participants.
Calculation Results for Cook’s Distances In this model, it appears that there are two significant
covariates, namely, anxiety symptoms and errors by
marking irrelevant characters.
Residual deviations range from -0.42871 to 0.39180.
The AIC value is 480.56 and the residual deviation value
is 2.5263 for 97 degrees of freedom. The suitability
analysis of this model shows a p-value=1.
According to the value of 1 obtained, the hypothesis that
this regression model is adequate is not rejected.
Then, a new value of the adjustment of the model was
carried out, from which the covariates to be included in
the gamma model were automatically selected.
Then, these three observations were removed from the The set of covariates and their coefficients obtained with
model and the gamma model was adjusted again (Table 3). the newly adjusted model are shown in Table 4.
Table 3
Variable Coefficients: Age, Anxiety Symptoms, Lie, Attention: Processed Characters, Attention: Hits, Attention: Default
Errors, Attention: Errors by Marking Irrelevant Characters for Adjusted Sample
Coefficients Estimated value SE t-value p-value
-
Intercept 2.179 0.122 17.747 ˂2e 16***
Age 0.006 0.009 0.72 0.48
Anxiety symptoms -0.008 0.004 -2.26 0.03*
Lie 0.002 0.007 0.31 0.76
Attention, PC 0.001 0.002 0.47 0.64
Attention, Hits 0.001 0.007 0.16 0.87
Attention, DE -0.003 0.006 -0.56 0.58
Attention, EMIC -0.016 0.005 -3.06 0.003**
Note. SE – standard error; p-value: *0.05; **0.01; ***0.001; PC – processed characters; DE – default errors; EMIC –
errors by marking irrelevant characters.
Table 4
Variable Coefficients: Anxiety Symptoms, Attention: Processed Characters, Attention: Default Errors, Attention: Errors
by Marking Irrelevant Characters for Adjusted Sample
Coefficients Estimated value SE t-value p-value
-
Intercept 2.25 0.081 27.824 ˂2e 16***
Anxiety symptoms -0.009 0.003 -2.664 0.009**
Attention, PC 0.002 0.000 8.84 3.44e 14***
-
Attention, DE -0.005 0.001 -3.52 0.000***
Attention, EMIC -0.016 0.005 -3.088 0.003**
Note. SE – standard error; p-value: *0.05; **0.01; ***0.001; PC – processed characters; DE – default errors; EMIC –
errors by marking irrelevant characters.
In this new adjustment, three covariates were eliminated, Figure 3
namely, age, lying, and the total number of hits of the Representation of the Residuals of the New Adjusted
attention task. With this new adjustment, there were now Model
four significant covariates: anxiety symptoms, characters
processed in the attention task, errors by omission, and
errors by marking irrelevant characters in the attention
task. Residual deviations range from -0.43140 to
0.37738. The AIC value is 475.34 and the residual
deviation value is 2.5450 with 100 degrees of freedom.
The value of p-value=1 and, for this reason, it is accepted
that this model is adequate. The analysis of the model’s
residuals (Figure 3) shows that the residuals are
distributed around 0, which indicates that this model fits
well with this data set.
Comparing this model with the previously adjusted
model, this model turns out to be better than the previous
one for this dataset.
14