
Page 25 - IJSA, Vol. 6, No 2, 2023
P. 25
International Journal of Science Annals, Vol. 6, No. 2, 2023
рrint ISSN: 2617-2682; online ISSN: 2707-3637; DOI:10.26697/ijsa
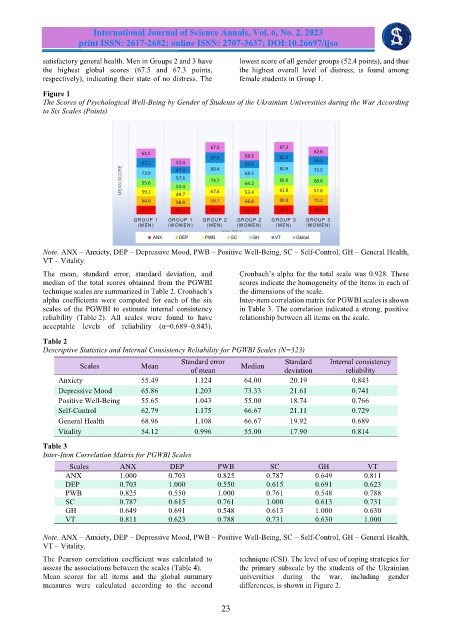
satisfactory general health. Men in Groups 2 and 3 have lowest score of all gender groups (52.4 points), and thus
the highest global scores (67.5 and 67.3 points, the highest overall level of distress, is found among
respectively), indicating their state of no distress. The female students in Group 1.
Figure 1
The Scores of Psychological Well-Being by Gender of Students of the Ukrainian Universities during the War According
to Six Scales (Points)
Note. ANX – Anxiety, DEP – Depressive Mood, PWB – Positive Well-Being, SC – Self-Control, GH – General Health,
VT – Vitality.
The mean, standard error, standard deviation, and Cronbach’s alpha for the total scale was 0.928. These
median of the total scores obtained from the PGWBI scores indicate the homogeneity of the items in each of
technique scales are summarized in Table 2. Cronbach’s the dimensions of the scale.
alpha coefficients were computed for each of the six Inter-item correlation matrix for PGWBI scales is shown
scales of the PGWBI to estimate internal consistency in Table 3. The correlation indicated a strong, positive
reliability (Table 2). All scales were found to have relationship between all items on the scale.
acceptable levels of reliability (α=0.689–0.843).
Table 2
Descriptive Statistics and Internal Consistency Reliability for PGWBI Scales (N=323)
Standard error Standard Internal consistency
Scales Mean Median
of mean deviation reliability
Anxiety 55.49 1.124 64.00 20.19 0.843
Depressive Mood 65.86 1.203 73.33 21.61 0.741
Positive Well-Being 55.65 1.043 55.00 18.74 0.766
Self-Control 62.79 1.175 66.67 21.11 0.729
General Health 68.96 1.108 66.67 19.92 0.689
Vitality 54.12 0.996 55.00 17.90 0.814
Table 3
Inter-Item Correlation Matrix for PGWBI Scales
Scales ANX DEP PWB SC GH VT
ANX 1.000 0.703 0.825 0.787 0.649 0.811
DEP 0.703 1.000 0.550 0.615 0.691 0.623
PWB 0.825 0.550 1.000 0.761 0.548 0.788
SC 0.787 0.615 0.761 1.000 0.613 0.731
GH 0.649 0.691 0.548 0.613 1.000 0.630
VT 0.811 0.623 0.788 0.731 0.630 1.000
Note. ANX – Anxiety, DEP – Depressive Mood, PWB – Positive Well-Being, SC – Self-Control, GH – General Health,
VT – Vitality.
The Pearson correlation coefficient was calculated to technique (CSI). The level of use of coping strategies for
assess the associations between the scales (Table 4). the primary subscale by the students of the Ukrainian
Mean scores for all items and the global summary universities during the war, including gender
measures were calculated according to the second differences, is shown in Figure 2.
23