
Page 56 - IJSA, Vol. 7, No 1, 2024
P. 56
International Journal of Science Annals, Vol. 7, No. 1, 2024
рrint ISSN: 2617-2682; online ISSN: 2707-3637; DOI:10.26697/ijsa
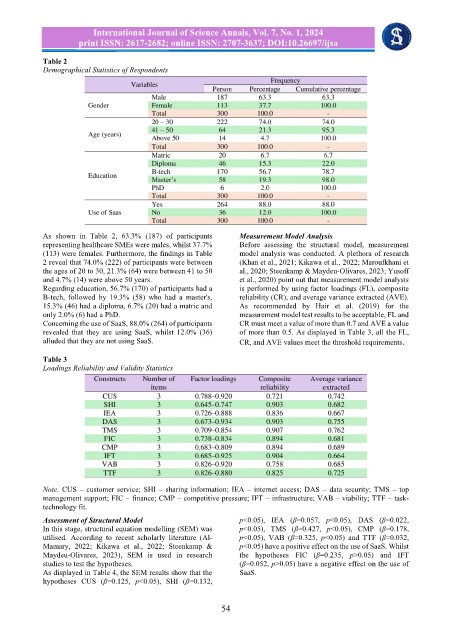
Table 2
Demographical Statistics of Respondents
As shown in Table 2, 63.3% (187) of participants Measurement Model Analysis
representing healthcare SMEs were males, whilst 37.7% Before assessing the structural model, measurement
(113) were females. Furthermore, the findings in Table model analysis was conducted. A plethora of research
2 reveal that 74.0% (222) of participants were between (Khan et al., 2021; Kikawa et al., 2022; Maroufkhani et
the ages of 20 to 30, 21.3% (64) were between 41 to 50 al., 2020; Steenkamp & Maydeu-Olivares, 2023; Yusoff
and 4.7% (14) were above 50 years. et al., 2020) point out that measurement model analysis
Regarding education, 56.7% (170) of participants had a is performed by using factor loadings (FL), composite
B-tech, followed by 19.3% (58) who had a master's, reliability (CR), and average variance extracted (AVE).
15.3% (46) had a diploma, 6.7% (20) had a matric and As recommended by Hair et al. (2019) for the
only 2.0% (6) had a PhD. measurement model test results to be acceptable, FL and
Concerning the use of SaaS, 88.0% (264) of participants CR must meet a value of more than 0.7 and AVE a value
revealed that they are using SaaS, whilst 12.0% (36) of more than 0.5. As displayed in Table 3, all the FL,
alluded that they are not using SaaS. CR, and AVE values meet the threshold requirements.
Table 3
Loadings Reliability and Validity Statistics
Note. CUS – customer service; SHI – sharing information; IEA – internet access; DAS – data security; TMS – top
management support; FIC – finance; CMP – competitive pressure; IFT – infrastructure; VAB – viability; TTF – task-
technology fit.
Assessment of Structural Model p<0.05), IEA (β=0.057, p<0.05), DAS (β=0.022,
In this stage, structural equation modelling (SEM) was p<0.05), TMS (β=0.427, p<0.05), CMP (β=0.178,
utilised. According to recent scholarly literature (Al- p<0.05), VAB (β=0.325, p<0.05) and TTF (β=0.032,
Mamary, 2022; Kikawa et al., 2022; Steenkamp & p<0.05) have a positive effect on the use of SaaS. Whilst
Maydeu-Olivares, 2023), SEM is used in research the hypotheses FIC (β=0.235, p>0.05) and IFT
studies to test the hypotheses. (β=0.052, p>0.05) have a negative effect on the use of
As displayed in Table 4, the SEM results show that the SaaS.
hypotheses CUS (β=0.125, p<0.05), SHI (β=0.132,
54