
Page 36 - IJSA, Vol. 6, No 1, 2023
P. 36
International Journal of Science Annals, Vol. 6, No. 1, 2023
рrint ISSN: 2617-2682; online ISSN: 2707-3637; DOI:10.26697/ijsa
2
centrifuged for 10 minutes at 3000 rpm to get sample t-test”. The chi-squared test (χ test) was applied
serum/plasma. The routine biochemical parameters to the categorical information. To ascertain the
were analyzed by standard methods using a Biosystem correlation between important parameters, Pearson’s
BA-400 chemistry analyzer. Apo B100 and Apo A1 correlation coefficient was determined. Significant was
were measured by turbidimetric immunoassay, endpoint defined as the p-value is less than 0.05.
method. Low-density lipoprotein and very low-density
lipoprotein cholesterol were calculated using Results
Friedewald’s equation (Friedewald et al., 1972). Table 1 shows the baseline characteristics of the studied
Statistical analysis subjects. Patients with essential hypertension and those
The data were analyzed using Statistical Package for serving as controls were statistically indistinguishable
Social Science version 20 (IBM, SPSS Statistics 20, from one another in terms of age and gender. Body mass
Armonk, NY, USA) and results were presented as index, SBP, and DBP were statistically significantly
mean±SD values. GraphPad Prism 5 was used to create increased in essential hypertension cases compared to
the graph. Statistical differences between cases and controls.
controls were examined using the “student independent
Table 1
Baseline Characteristics of Studied Subjects
Variables Controls Cases
Age (years) 48.24±11.23 48.70±11.82 NS
NS
Sex (M/F) 113/137 114/136
BMI (Kg/m ) 21.89±1.00 27.60±1.68 **
2
SBP (mmHg) 115.32±3.95 155.35±7.40 **
DBP (mmHg) 76.12±4.95 96.03±5.57 **
**
Note. NS Not significant (p>0.05); Significant at p<0.001; BMI=Body mass index; SBP=Systolic blood pressure;
DBP=Diastolic blood pressure.
Table 2 shows fasting blood glucose and lipid profiles in significantly reduced in essential hypertension subjects.
the studied subjects. In essential hypertension subjects, Apolipoprotein B100 was increased in essential
fasting blood glucose (FBG) and all the lipid parameters hypertension subjects whereas Apo A1 was reduced
i.e. TC, TG, LDL, and VLDL except HDL were compared to normal healthy control subjects and these
increased compared to control subjects and were differences were statistically significant.
statistically significant whereas HDL was statistically
Table 2
Fasting Blood Sugar and Lipid Profile in Studied Subjects
Variables Controls Cases
FBG (mg/dl) 85.08±6.23 95.01±7.22 **
TC (mg/dl) 170.74±12.40 220.57±11.48 **
TG (mg/dl) 135.37±7.77 236.32±47.10 **
HDL-C (mg/dl) 52.83±4.67 37.34±3.98 **
LDL-C (mg/dl) 90.83±13.35 135.97±11.63 **
VLDL-C (mg/dl) 27.07±1.55 47.26±9.42 **
Apo A1(mg/dl) 128.96±25.73 87.83±4.14 **
Apo B100 (mg/dl) 99.50±22.44 149.87±11.30 **
**
Note. Significant at p<0.001; FBG= Fasting blood glucose; TC=Total cholesterol; TG=Triglyceride; HDL-C=High
density lipoprotein cholesterol; LDL-C=Low density lipoprotein cholesterol; VLDL-C=Very low density lipoprotein
cholesterol.
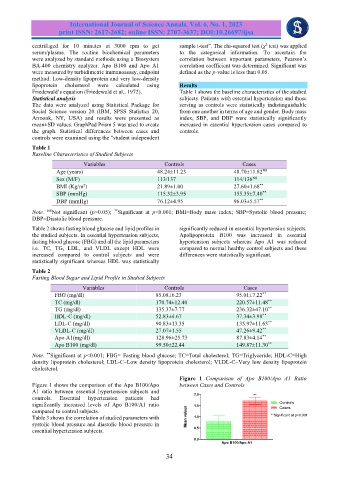
Figure 1 Comparison of Apo B100/Apo A1 Ratio
Figure 1 shows the comparison of the Apo B100/Apo between Cases and Controls
A1 ratio between essential hypertension subjects and 2.0
controls. Essential hypertension patients had **
significantly increased levels of Apo B100/A1 ratio 1.5 Controls
Cases
compared to control subjects.
Table 3 shows the correlation of studied parameters with Mean values 1.0 **Significant at p<0.001
systolic blood pressure and diastolic blood pressure in
essential hypertension subjects. 0.5
0.0
Apo B100/Apo A1
34