
Page 16 - IJSA, Vol. 4, No 2, 2021
P. 16
International Journal of Science Annals, Vol. 4, No. 2, 2021
рrint ISSN: 2617-2682; online ISSN: 2707-3637; DOI:10.26697/ijsa
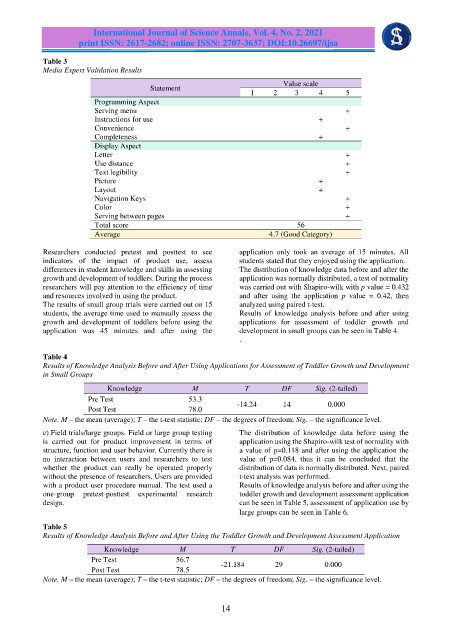
Table 3
Media Expert Validation Results
Value scale
Statement
1 2 3 4 5
Programming Aspect
Serving menu +
Instructions for use +
Convenience +
Completeness +
Display Aspect
Letter +
Use distance +
Text legibility +
Picture +
Layout +
Navigation Keys +
Color +
Serving between pages +
Total score 56
Average 4.7 (Good Category)
Researchers conducted pretest and posttest to see application only took an average of 15 minutes. All
indicators of the impact of product use, assess students stated that they enjoyed using the application.
differences in student knowledge and skills in assessing The distribution of knowledge data before and after the
growth and development of toddlers. During the process application was normally distributed, a test of normality
researchers will pay attention to the efficiency of time was carried out with Shapiro-wilk with p value = 0.432
and resources involved in using the product. and after using the application p value = 0.42, then
The results of small group trials were carried out on 15 analyzed using paired t-test.
students, the average time used to manually assess the Results of knowledge analysis before and after using
growth and development of toddlers before using the applications for assessment of toddler growth and
application was 45 minutes and after using the development in small groups can be seen in Table 4.
.
Table 4
Results of Knowledge Analysis Before and After Using Applications for Assessment of Toddler Growth and Development
in Small Groups
Knowledge M T DF Sig. (2-tailed)
Pre Test 53.3 -14.24 14 0.000
Post Test 78.0
Note. M – the mean (average); T – the t-test statistic; DF – the degrees of freedom; Sig. – the significance level.
c) Field trials/large groups. Field or large group testing The distribution of knowledge data before using the
is carried out for product improvement in terms of application using the Shapiro-wilk test of normality with
structure, function and user behavior. Currently there is a value of p=0.118 and after using the application the
no interaction between users and researchers to test value of p=0.084, thus it can be concluded that the
whether the product can really be operated properly distribution of data is normally distributed. Next, paired
without the presence of researchers. Users are provided t-test analysis was performed.
with a product user procedure manual. The test used a Results of knowledge analysis before and after using the
one-group pretest-posttest experimental research toddler growth and development assessment application
design. can be seen in Table 5, assessment of application use by
large groups can be seen in Table 6.
Table 5
Results of Knowledge Analysis Before and After Using the Toddler Growth and Development Assessment Application
Knowledge M T DF Sig. (2-tailed)
Pre Test 56.7 -21.184 29 0.000
Post Test 78.5
Note. M – the mean (average); T – the t-test statistic; DF – the degrees of freedom; Sig. – the significance level.
14